In quantitative trading, identifying anomalies in price movements can help uncover profitable opportunities, or alpha, that are not explained by the market. One powerful technique for this is Z-score-based anomaly detection, which highlights extreme deviations from a rolling mean.
In this article, we demonstrate a strategy that detects these anomalies and evaluates whether exploiting them can produce alpha.
Detecting Anomalies with Z-Score
The first step is calculating the rolling Z-score over the closing prices. This allows us to quantify how far a value deviates from its recent history:
df[‘rolling_mean’] = df[‘Close’].rolling(window=200).mean()
df[‘rolling_std’] = df[‘Close’].rolling(window=200).std()
df[‘zscore’] = (df[‘Close’] – df[‘rolling_mean’]) / df[‘rolling_std’]
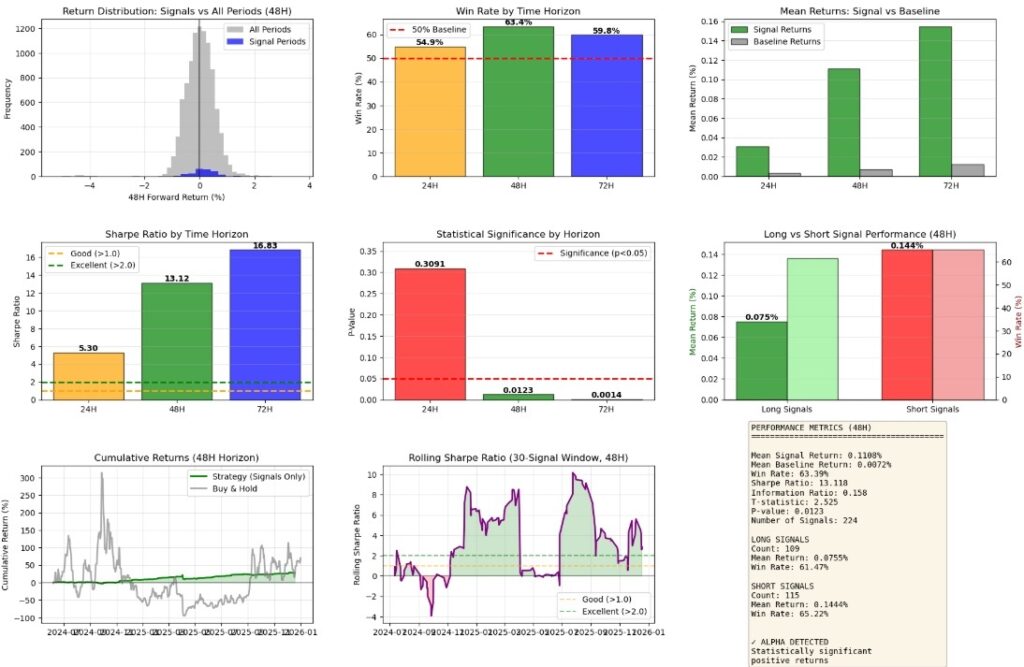
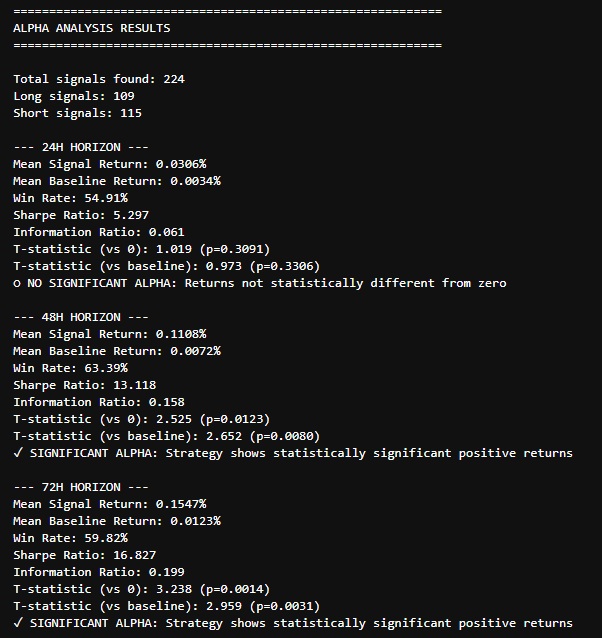
Here, any significant deviation above or below a threshold is considered an anomaly. These anomalies are then flagged as potential reversal signals.
Generating Signals and Measuring Forward Returns
Once anomalies are detected, we define long and short signals based on threshold crossings. Forward returns are calculated to see if acting on these signals produces positive outcomes:
df[‘long_signal’] = ((df[‘zscore’].shift(1) < -2) & (df[‘zscore’] >= -2)).astype(int)
df[‘short_signal’] = ((df[‘zscore’].shift(1) > 2) & (df[‘zscore’] <= 2)).astype(int)
df[‘signal’] = df[‘long_signal’] – df[‘short_signal’]
df[‘signal_return_48h’] = df[‘signal’] * (df[‘Close’].shift(-48) – df[‘Close’]) / df[‘Close’]
This approach allows us to evaluate the alpha generated by exploiting statistical anomalies in the data.
Testing Alpha In-Sample vs Out-of-Sample
To avoid overfitting, it’s crucial to separate the data into in-sample (training) and out-of-sample (testing) periods. The strategy is evaluated on both to determine its robustness:
split_idx = int(len(df) * 0.7)
df_in = df.iloc[:split_idx] # In-sample
df_out = df.iloc[split_idx:] # Out-of-sample
results_in = test_alpha(df_in)
results_out = test_alpha(df_out) By comparing cumulative returns, win rates, and Sharpe ratios across these periods, we can assess whether the anomalies truly provide alpha or are just random noise.
Key Takeaways
- Anomaly Detection via Z-score is a simple yet powerful method to identify extreme deviations in time series data.
- Signal-based alpha testing helps quantify if exploiting these anomalies generates statistically significant returns.
- In-sample vs Out-of-sample analysis is critical to ensure the strategy’s robustness and avoid overfitting.
Using these methods, quantitative analysts can systematically uncover anomalies in markets and evaluate strategies that may generate alpha.